Dot Plots are useful for showing discreet values. It also have the option of showing a secondary measure as bubble size.
Custom Dot plot visual for powerBI comes with following features:
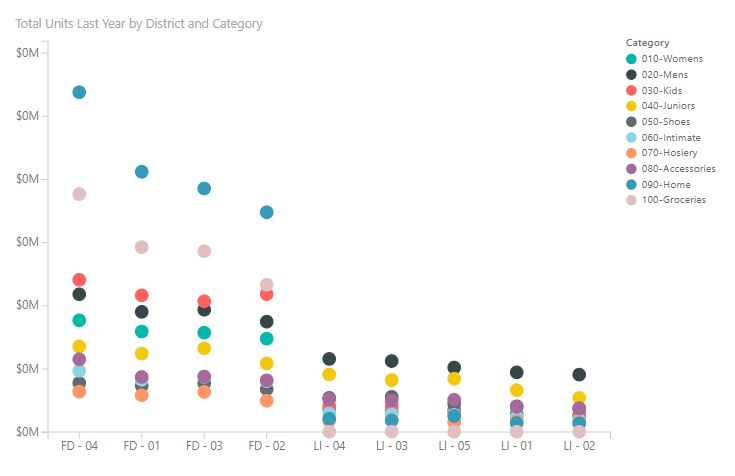
Basic dot plot – Colored by dimension
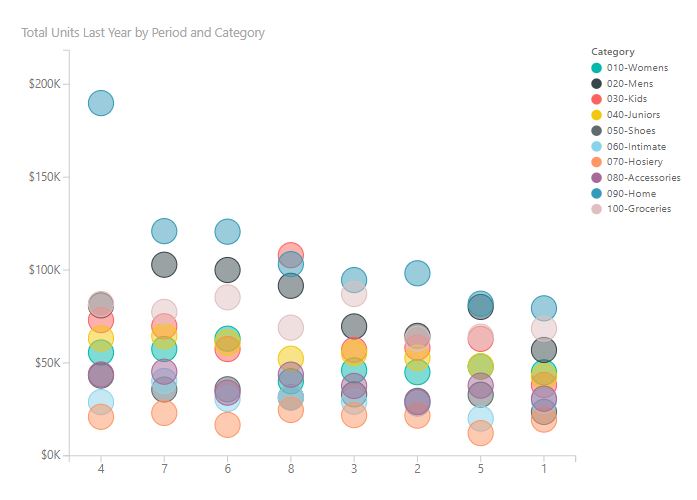
Dot Plot – Dot opacity property
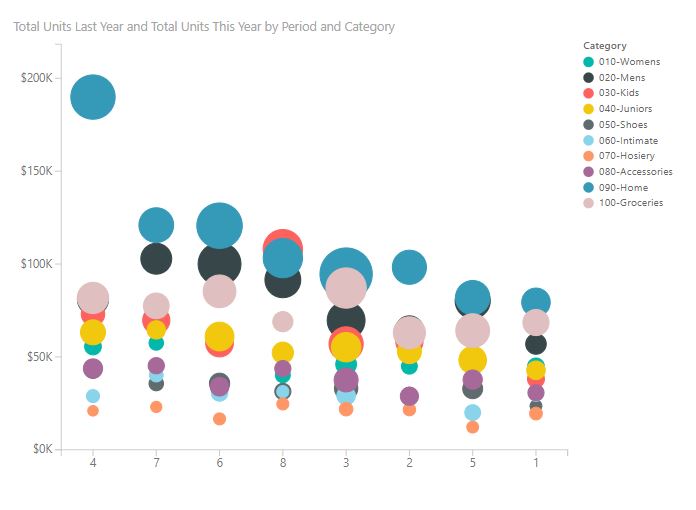
Dot Plot – Size by dimension
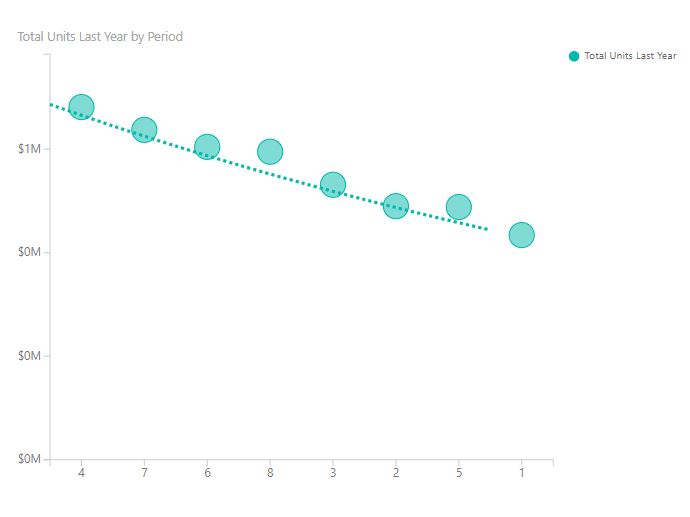
Dot Plot with- exponential curve
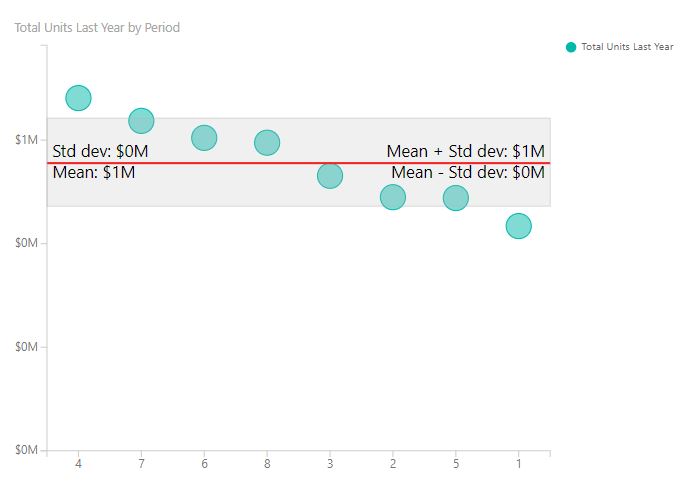
Dot plot with Standard deviation and Means
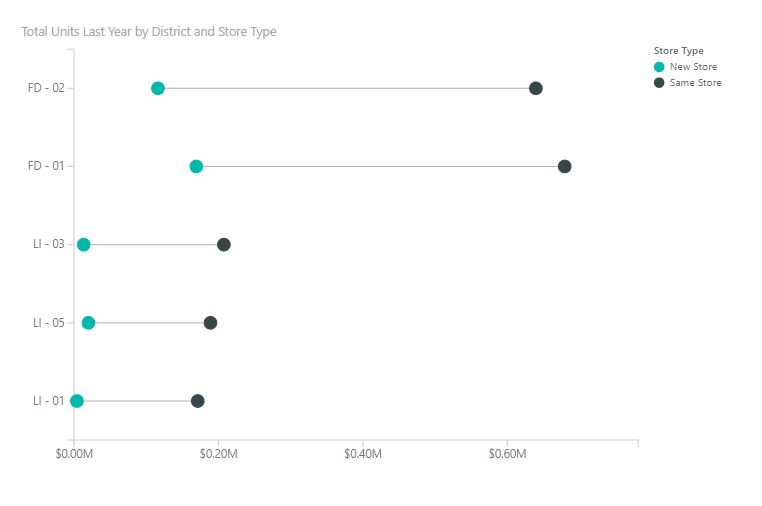
Dot plot example as Dumbbell chart