
Heatmaps are useful to understand the relationship between a single measure and two attributes. It displays data in 2 dimension in data matrix.
Power BI Heat Map
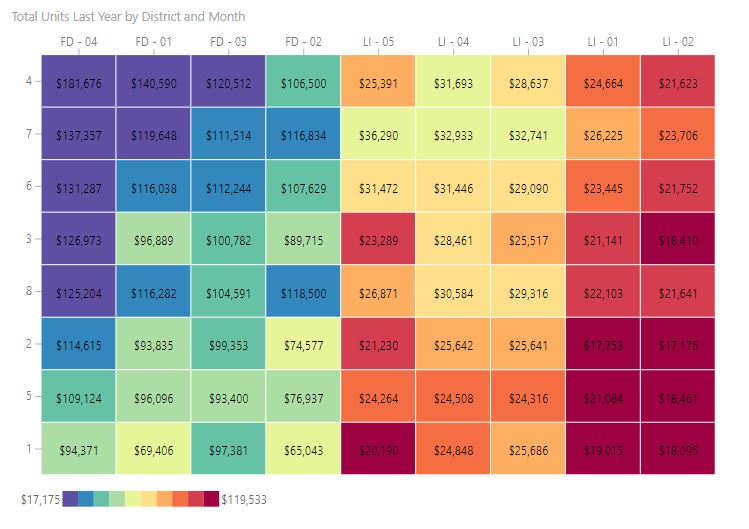
Simple Heat Map
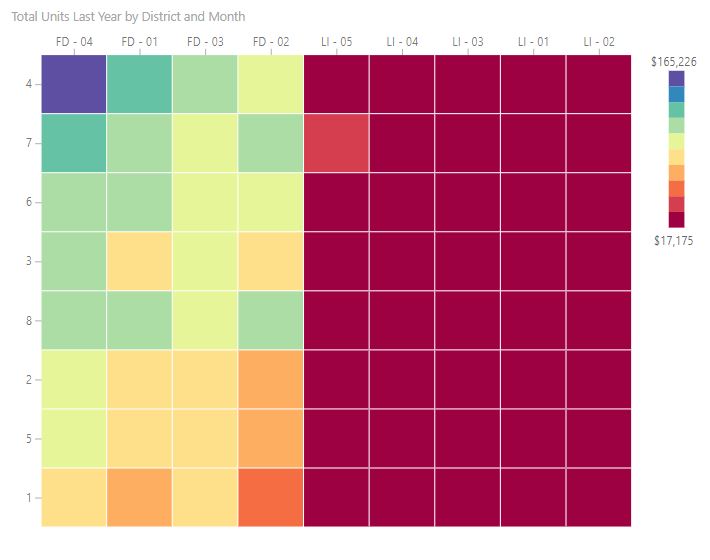
Bar code chart feature of Heat map of PowerBI

Bar Code chart with one Measure and Date for PowerBI
